
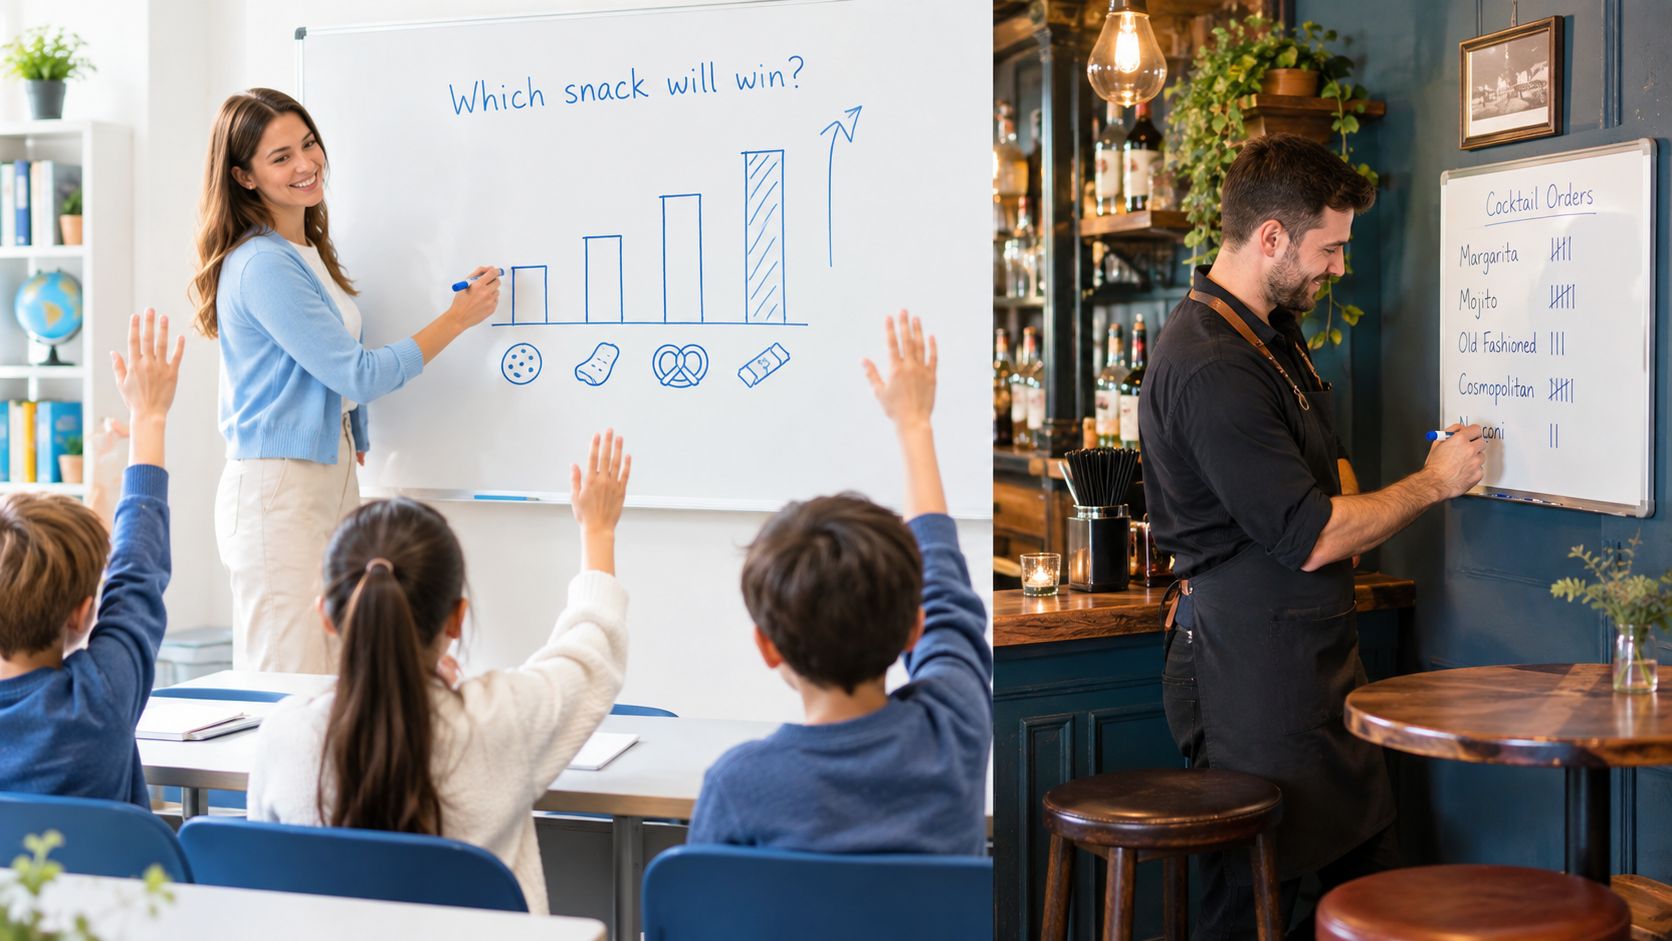
A teacher draws a bar across the whiteboard and asks which snack the class thinks will win. Hands go up, guesses compete, and the chart grows as each vote becomes visible. Later that evening, a host in an Amsterdam bar uses the same idea on a smaller scale, tallying drink choices or trivia points while a group watches the leaderboard change.
That simple shift, from answers to live choices, is what makes bar graph games useful far beyond worksheets. A chart can help students understand comparison, give party guests an easy conversation starter, or keep a pub-crawl group involved between stops. The bars aren't the entertainment by themselves. They're the scoreboard, the shared record, and often the reason people start talking.
Table of Contents
- What Bar Graph Games Are
- Where Bar Graph Games Come From
- The Design Pattern Behind the Best Bar Games
- Classroom Drills vs Real-World Group Play
- Three Bar Graph Games You Can Run This Week
- Planning a Bar Graph Game Night Without the Stress
- Why Bar Graph Games Belong in Amsterdam Nights Out
What Bar Graph Games Are
A bar graph game is a structured activity in which players create data through their choices or actions, then display the results as a readable bar chart. Participants provide information, someone records it, and the group interprets the changing bars. In a classroom, that may mean building a chart from snack preferences. At a pub, it could mean tracking trivia points, drink choices, or votes during a busy Amsterdam night.
The chart turns individual decisions into a shared record. Each bar represents a category, while its height or length shows how much support, activity, or progress that category has received. This explanation of graphing data/08:_Concepts_in_Statistics/8.01:_Statistical_Graphs_and_Tables/8.1.01:_Graphing_Data) provides a useful foundation for reading categories, scales, and quantities. A large scale can make broad comparisons easy while making exact values harder to identify, so clear labels and sensible intervals matter.
The two main formats
An educational drill gives the teacher control over the question and data set. Students may build vertical or horizontal bars, answer one-step questions, or compare two categories. The learning goal might be identifying the largest category or calculating the difference between bars.
Social group play uses the same structure with more spontaneous inputs. Guests can vote on a superlative, add points for trivia answers, record completed dares, or choose the next stop on a pub crawl. A host can update the chart on a whiteboard, card, or shared display while the group watches its shape change.
A resource offering Wi-Fi data visualization insights can help hosts consider how raw activity becomes a readable visual record. On any surface, use clear category names, consistent units, and enough room for new entries.
Why the chart matters
The chart supports the activity by making group behavior visible. A quiet guest can follow the score without speaking, a late arrival can understand the situation quickly, and the host can settle a disagreement by checking the tally.
That flexibility makes bar graph games useful for students, travelers, birthday groups, boat parties, and nightlife crowds. The topic changes, while the mechanic stays clear: people contribute, the group records the results, and the bars give everyone a shared reason to compare.
Where Bar Graph Games Come From
The history of bar graph games has two strands. One comes from statistical visualization, and the other comes from recreational boards and structured play.
William Playfair's 1786 book The Commercial and Political Atlas is widely cited as a seminal milestone for modern chart graphics, including bar charts and line charts. His work helped establish charts as practical tools for comparing information rather than merely decorating a page. The historical discussion in this overview of early graph drawing and chart history places modern graph use within a much longer story.

The playful strand reaches back through graph-like game boards. Some early examples may date to ancient Egypt, and later game traditions were documented in the 13th-century Book of Games under Alfonso X. The dates matter less than the connection. People have long used visual layouts to track positions, choices, progress, and rank.
Two traditions meet
A bar graph game sits where those traditions overlap. The statistical side contributes categories, scales, comparison, and visible evidence. The recreational side contributes turns, stakes, surprise, and a reason to care about the next mark on the board.
Classrooms later made bar graphs part of everyday numeracy. Teachers could turn a collection of answers into a shared visual object, then ask students to interpret it. Pubs, youth groups, parties, and other social settings developed related tally-based activities, even when nobody used the formal language of data visualization.
The result isn't a modern invention created from nothing. It's a natural collision between measurement and play. A chart gives a group a common reference point, while a game gives the chart emotional energy. A rising bar can represent a correct answer, a popular choice, a completed challenge, or a lead worth chasing.
That dual heritage also explains why the format travels well. It can be serious enough for a lesson and loose enough for a night out. The visible structure stays stable, while the questions and consequences change with the audience.
The Design Pattern Behind the Best Bar Games
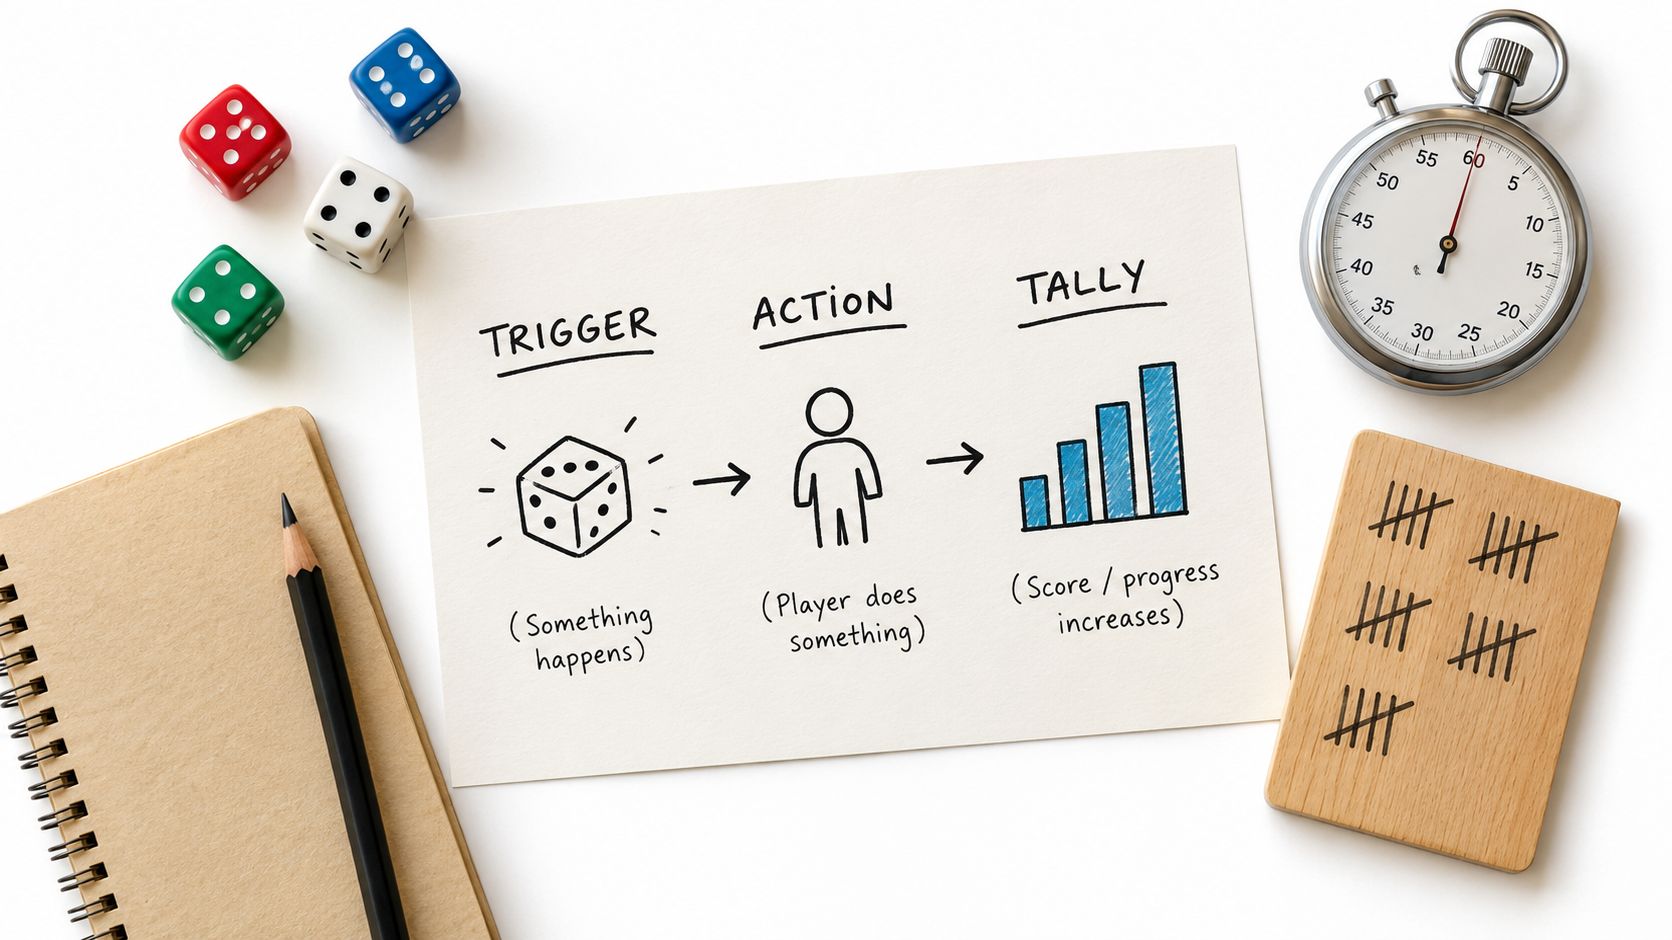
Some games lose a group after one round because players can't tell what starts the action, what earns points, or why the score matters. Stronger formats make those elements obvious from the beginning. They usually follow a trigger, consequence, progression pattern, a structure associated with durable engagement in bar games. This discussion of bar-game mechanics describes the same basic sequence in the context of social play.
Start with a measurable trigger
A trigger tells people that a round has begun. It might be a question, a vote, a completed challenge, a stop on a route, or a host calling for the next prediction. The trigger needs to produce an input that can be recorded without interpretation.
For example, a teacher asks, “Which snack will receive the most votes?” A party host asks guests to choose the funniest travel habit. A pub-crawl host asks a team to complete a short challenge before adding a point to its bar. Each trigger creates an observable event.
The consequence should follow quickly. A correct answer earns a point, a selected option receives a mark, or a completed action changes the tally. Delays weaken the connection between action and result, especially in noisy venues where attention moves quickly.
Let progression stay visible
Progression gives people a reason to watch the next round. Tall bars signal a lead, short bars suggest a comeback, and close scores invite more participation. Predictable scoring helps newcomers understand the game without needing a long briefing.
Practical rule: If a player can't explain how an action changes the chart, the scoring system needs simplifying.
The chart performs two jobs at once. It acts as a referee because it records what happened, and it acts as a hype crew because everyone can see momentum shift. Hosts shouldn't hide the tally in a notebook. A whiteboard, projected chart, paper scorecard, or shared screen works better when players can check it at a glance.
A good design also leaves room for variation. Cricket darts, for example, asks players to close 15 through 20 and the bullseye, hitting each target three times before it can be closed. Once one side closes a number, additional hits can score points until the opponent closes it too. These cricket darts rules show how a visible target list can combine progress, pressure, and comeback potential.
The lesson for bar graph games is straightforward: define the trigger, show the consequence, and keep progression public.
Classroom Drills vs Real-World Group Play
The chart may look similar in both settings, but the surrounding experience changes sharply. A classroom usually prioritizes accuracy, individual reasoning, and teacher-led pacing. A bar, party, or nightlife event prioritizes quick participation, social comfort, and a score that can survive interruptions.
| Element | Classroom Setup | Real-World Group Play |
|---|---|---|
| Question source | Teacher-selected data set | Host-led poll, challenge, or live choice |
| Recording method | Handout, board, or learning display | Whiteboard, phone, card, or shared screen |
| Main outcome | Reading, comparing, or creating a graph | Conversation, competition, and group momentum |
| Turn-taking | Often individual or team-based | Fast, flexible, and sometimes simultaneous |
| Scoring | Consistent and assessment-friendly | Looser, visible, and easy to adjust |
| Distractions | Managed by the teacher | Noise, movement, drinks, and late arrivals |
The classroom version
Students might work from a prepared data set, answer questions in a subdued manner, and explain how they reached a conclusion. The teacher can pause after each step to discuss categories, labels, scales, and comparisons. The bar graph becomes a learning object that rewards careful reading.
That focus explains why many existing bar graph games stay close to elementary practice. They ask players to read counts, compare values, or subtract one bar from another, but rarely explore how charts help adults notice patterns, communicate uncertainty, or make group decisions. The gap matters because a host isn't trying to complete a worksheet. The host is trying to turn preferences into a usable choice.
The social version
At a party, the same chart becomes a social prompt. Guests can vote, tease friends about the leading category, or use the result to choose a song, theme, or next activity. On a pub crawl, a tally can keep people involved while the group moves between venues.
Solo travelers often need low-pressure ways to join a group, and a simple question provides that opening. Practical ideas for meeting people appear in these tips for making friends on a pub crawl, but the chart adds a useful visual layer. A newcomer can contribute one vote or one point before starting a longer conversation.
Operators can use the same approach to crowd-source opinions across a venue. The question might concern music, a themed challenge, or the next group activity. The chart doesn't replace good hosting. It gives the host a visible feedback loop that makes participation easier.
Three Bar Graph Games You Can Run This Week
A classroom vote can become a live chart in minutes. The same setup also works at a party or on a pub crawl, where each new mark gives people something to predict, discuss, and follow. The three activities below share one structure: a prompt starts the round, people add visible data, and the changing bars create a reason to stay involved.
A prediction vote for the classroom
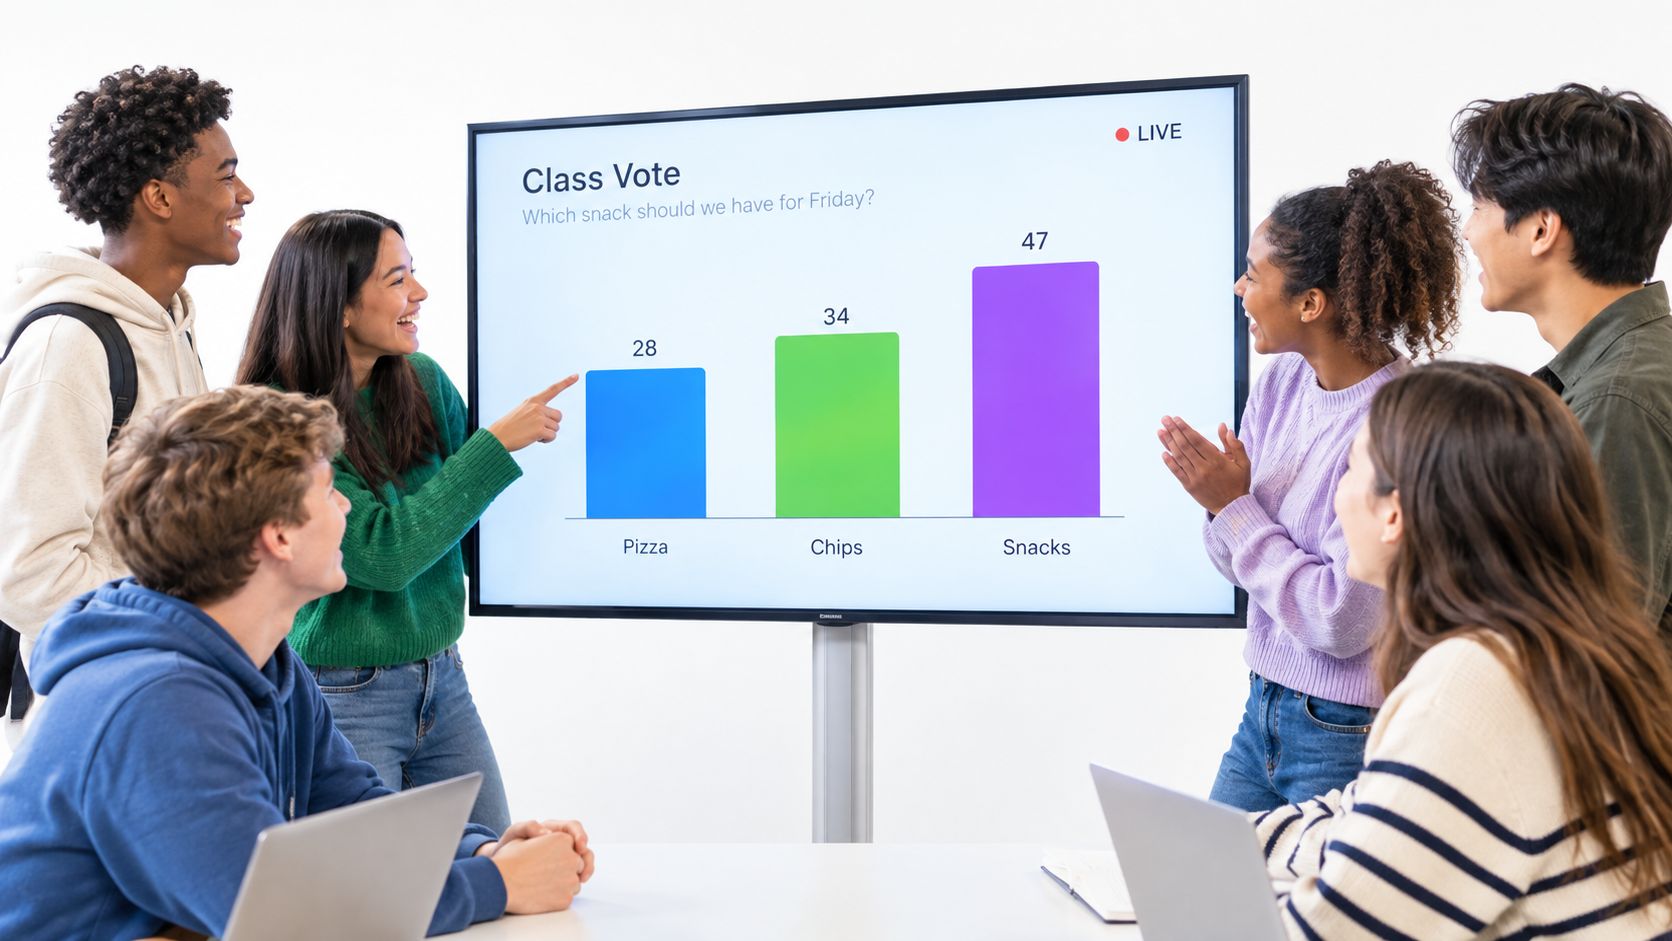
Setup: Write several snack categories on a board. Before anyone votes, give each student one prediction: which category will finish with the tallest bar? This first guess gives students a reason to watch the chart instead of treating each mark as a separate task.
Inputs: Each student casts one vote, and the teacher records it in the matching category. Use a clear scale, with labels large enough for the whole room to read. If the group is large, leave room above every bar so the chart can grow without being redrawn.
Running tally: Add marks as votes arrive. After a short batch, pause and ask whether the current leader is likely to stay ahead. A bar that leads early has an advantage, not a guaranteed result. Students can compare the visible evidence with their original predictions and explain what might change.
Round length: Keep the voting round brief, then allow time to discuss the prediction and compare the finished bars.
Payoff: Students practice reading, comparing, and explaining data while attention is still on the changing chart. The activity adds prediction, evidence, and spoken reasoning to a task that might otherwise remain a quiet worksheet exercise.
A superlative board for a party
Setup: Put three or four light-hearted categories on a shared whiteboard, such as “most likely to miss a train” or “best emergency snack.” Guests can nominate people or vote for categories, depending on the group's comfort level. Use prompts that invite laughter without putting one guest under uncomfortable pressure.
Inputs: One vote adds one mark. Invite everyone to vote together, then ask a few people why they chose their answer. A newcomer can contribute immediately without needing to make a formal introduction.
Running tally: Update the chart after each voting burst and keep it where guests can see it. If one category becomes clearly dominant, introduce a fresh prompt rather than stretching the same round past its lively point.
Round length: Each question should allow time to vote, react, and move on. Short rounds help the board stay part of the conversation instead of becoming wall decoration.
Payoff: The bars provide a shared subject for conversation. The host gains an easy icebreaker, while guests get a natural opening line and a reason to compare opinions.
A route leaderboard for a pub crawl
Setup: Create categories for players or teams, then track points across selected pubs, bars, or restaurants. A PubGolf-style scorecard can define players, points, and a route before the evening begins. This PubGolf scorecard example shows how that structure can be organized.
Inputs: Each stop supplies a measurable action, such as a trivia answer, team challenge, or host-approved participation task. Alcohol should not be the only way to earn points. Guests who do not drink need an equally clear route to participate, and responsible choices keep the game welcoming.
Running tally: Update the bars at each stop rather than after every small action. Use a paper scorecard when phones are inconvenient. A whiteboard or shared display creates more public excitement because the group can see the standings change together.
Round length: Treat each venue as one round, with enough time for conversation and movement. The chart should support the night, not turn it into paperwork.
Payoff: At the final tally, the tallest bar can earn a non-cash recognition, playful title, or planned prize. The satisfying part is seeing the route build from the first mark to the final leaderboard.
All three games turn a simple chart into a group-engagement tool. The classroom emphasizes interpretation, the party encourages conversation, and the crawl builds shared momentum from stop to stop.
Planning a Bar Graph Game Night Without the Stress
A relaxed host plans the chart before the guests arrive, then leaves enough flexibility to respond to the room. The preparation doesn't need to be elaborate. It needs to answer four questions: what starts a round, who records the result, how players see the score, and what happens if attention drops.
Prepare the practical layer
Choose the display first. A classroom may use a board or projector, while a party host may prefer paper cards or a whiteboard. A venue that doesn't allow writing on surfaces needs a portable option, and a noisy room may need a phone-based tally or a host holding up category cards.
Assign scorekeeping to one person. The host can focus on explaining and encouraging participation while a helper records marks. If no helper is available, use simple symbols and update the chart in batches rather than trying to document every movement instantly.
A chart should make the evening easier, not turn the host into a full-time accountant.
Protect the pace
Slow rounds usually come from questions that require too much explanation. Use prompts that guests can answer quickly, then keep a reserve of simpler questions for a lull. Ties need a rule before they happen, such as a final deciding vote, shared recognition, or a new short challenge.
Disengagement often signals that the chart has become background decoration. Bring it back into the room by asking players to predict the next leader, inviting a late arrival to make a vote, or changing the category. Don't punish guests for stepping away, since social events need room for conversation.
A practical sequence looks like this:
- Invite clearly: Tell guests that the activity is optional, social, and easy to join.
- Show the board: Explain the categories and the scoring in one short example.
- Run a warm-up: Use a low-pressure question to test the flow.
- Record visibly: Keep marks large, consistent, and easy to audit.
- Add variety: Mix predictions, votes, and team actions.
- Close cleanly: Announce the final tally and let the group move on.
For visitors comparing ways to enjoy the city without overcomplicating the evening, this guide to experiencing Amsterdam nightlife on a budget offers useful planning context. The same principle applies to the game: clear choices and a visible plan reduce friction.
Why Bar Graph Games Belong in Amsterdam Nights Out
Amsterdam suits live group mechanics because visitors often move between compact nightlife areas, shared activities, and changing social circles. A bar graph can travel with the group, whether it appears on a small card, a phone, or a board brought out during a pause.
The format also works well for pub crawls. A host can ask for a quick poll at each stop, record the result, and maintain a running leaderboard. Guests see the group changing as the evening continues, while the host gains a simple way to re-engage people who have started talking in separate clusters.
A moving crowd needs visible structure
Noise and movement don't automatically rule out a chart. They change how the host presents it. Questions should be short, categories should use clear words or symbols, and the score should be shown in a format that can be understood without a long explanation.
International groups may not share the same first language, so visual prompts help. A color-coded bar, a simple icon, or a demonstration round can communicate the rule faster than a detailed speech. Hosts should also avoid making alcohol consumption the condition for participation. Points can come from answers, teamwork, observation, or playful challenges instead.
The broader nightlife scene includes more than bars. This guide to Amsterdam nightlife beyond bars reflects the range of evening plans visitors may combine, and a portable tally can adapt across those settings without becoming the main event.
Ultimate Party Amsterdam offers guided pub crawls and canal booze cruises where hosted group activities can complement the route. Used thoughtfully, a bar graph can turn a moving crowd into a shared story, with each stop adding another visible piece of information.
The strongest argument isn't that every Amsterdam night needs a formal game. It doesn't. The point is that operators who want more interaction can use a lightweight chart to connect people, guide attention, and make friendly competition easy to follow. The host still sets the tone, but the bars give the group something concrete to notice.
For a social Amsterdam night with built-in movement, hosted interaction, and options including pub crawls and canal booze cruises, visit Ultimate Party Amsterdam. Groups can use the simple bar graph ideas in this article as extra icebreakers while exploring the city with a planned nightlife experience.
🍻
Experience it Yourself
Skip the planning — join Amsterdam's biggest pub crawl and get 6 bars, free drinks and VIP club entry for €20.